The memo engine
The Memo panel on the Session Dashboard is the whole session on one screen. It re-renders once a second and colour-codes every device and stream by state. This page explains what it's doing so the colours mean something to you.
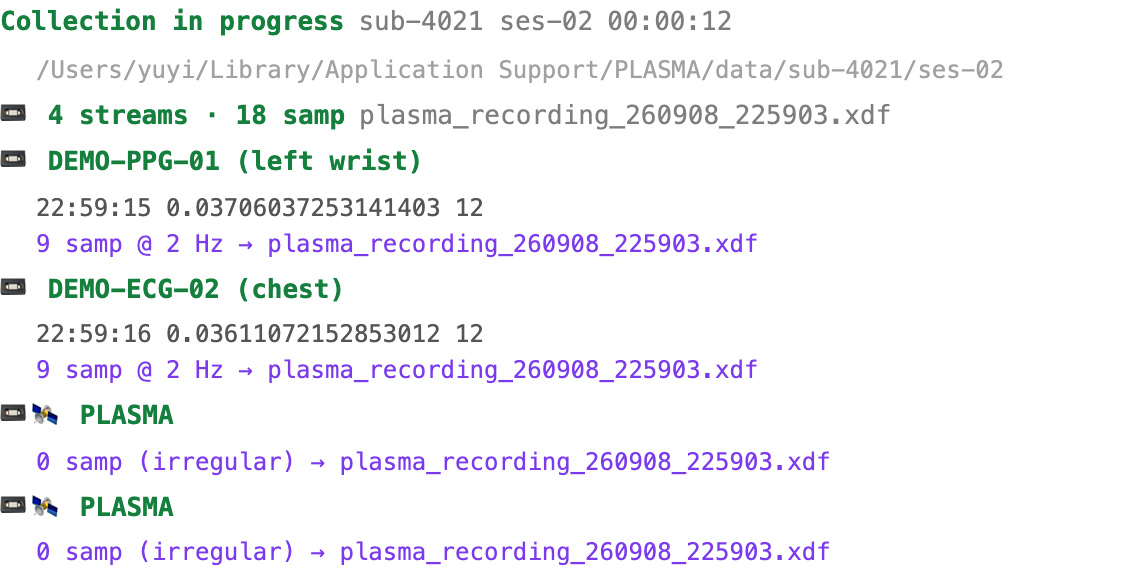
What you're looking at
- Header line — the session status ("Collection in progress"), the
sub/sesIDs, and — once you press Start — anHH:MM:SSelapsed clock. Its colour is the worst state anywhere in the session. - Second line — the session folder on disk.
- 📼 recorder row — the XDF file, stream count, total samples.
- One row per device / sub-source — the name, its latest value, and (when
recording) a
📼 N samp @ X Hz → fileline. A📼🛰row is a recorded stream with no local device (external software, PLASMA's own journal stream). Before Start, plain🛰rows list other LSL streams seen on the network.
Status is the colour of the device name, not an icon. Drivers still write little glyph strings ("🟢", "🔌 disconnected", …) but the colour is what the classifier decides.
The colours
| Colour | Name | Shown for |
|---|---|---|
| green | healthy | capturing normally |
| neutral | info | idle / ready / an expected stop |
| blue | advisory | continue, but do one thing soon (re-Initialize, reconnect, low battery) |
| amber | caution | interrupted but recovering, or a one-click operator fix |
| red | warning | capture stopped mid-session, unrecoverable, or integrity compromised |
| purple | guidance | a recording-stats sub-line accent, or a brief "Initializing.../Starting.../Stopping..." while devices catch up |
| grey | external | an LSL stream on the network that isn't ours |
Internally these map to a three-level severity model (advisory / caution / warning) adapted from Airbus ECAM — the failure-levels reference has the full table. The levels are never shown; you only ever see the colour.
The phase gate
The same status means different things before, during, and after a collection. PLASMA tracks three phases from the Start / Stop buttons:
| Phase | When | "stopped" device means |
|---|---|---|
| SETUP | before Start | not collecting yet — normal, suppressed |
| COLLECTING | Start pressed, not Stopped | a sensor stopped mid-collection → red |
| STOPPED | Stop pressed | expected → neutral |
So a completed session and a crashed sensor no longer look identical.
How a row's colour is decided
Each device row takes the worst of three inputs:
- What the driver reported — its status glyph string (
🔌 disconnected,⚠️ start failed,🔄 reconnected, …). - Its recorded stream's health — if the LSL stream that device publishes
goes
🟡 stale(amber) or🔴 lost(red) during a recording, the row escalates even if the driver never noticed. A silent stream can't hide behind a frozen sample count. - MSense SQC / live-stream transfer state — a rejected or failed signal-quality snapshot turns that wristband's row amber.
The header colour is the worst row anywhere, so one glance tells you whether the whole session is nominal.
The durable trail
The panel is live and in-memory. Two things outlast it:
events.jsonl— every colour change (fault / recover), phase change, recorder state change and a 30-second heartbeat, appended as JSON lines to both<home>/data/events.jsonl(all sessions) and the session folder. It survives a restart. Schema in Files & paths.[FAULT]/[RECOVER]journal markers — a fault also pushes a marker onto the journaler LSL stream, so it lands inside the.xdfat the right timestamp.
Reading it headlessly
You don't need the browser open:
plasma-ctl status                 # phase + per-device colour/level table
plasma-ctl watch --fail-on L3     # poll; exit non-zero the moment anything goes red
plasma-ctl events --min-level L2  # the durable fault history
Full API: Headless control & API.
Next: Abnormal handling.